Elastic Band
Like a lot of people, I’m wanting to replace Splunk. To that end I’ve been looking into Elasticsearch.
My prerequisites are:
- Replace Splunk Enterprise (or Splunk Free) with Elastic and its web UI Kibana;
- Replace Splunk Forwarder with Filebeat;
- Consume syslog over UDP using rsyslog;
- Use TLSv1.2 or better;
- Have an easy to deploy, low-resource client;
- Not use the resource-hungry Logstash.
So I’ve downloaded the RPM’s for the stack I want to use (some extra beats to play with too) and we’ll also install a JDK and a couple of rsyslog modules for later, this was all for CentOS 8.2, but I’ve tested Filebeat at least with SLES 12SP5:
dnf install java-1.8.0-openjdk-headless rsyslog-elasticsearch rsyslog-mmjsonparse
rpm -ivh elasticsearch-7.8.0-x86_64.rpm kibana-7.8.0-x86_64.rpm filebeat-7.8.0-x86_64.rpm journalbeat-7.8.0-x86_64.rpm auditbeat-7.8.0-x86_64.rpm metricbeat-7.8.0-x86_64.rpm
As I’m going to use TLS certificates, I needed to give my VM’s proper hostnames, so both the server and the clients need this added to /etc/hosts:
192.168.0.97 elastic elastic.local
Using the documentation here I created some self-signed certificates. My /root/certs/instance.yml looks like this:
instances:
  - name: 'elastic'
    dns: [ 'elastic.local' ]
Then I ran this to create the certs and copy them into place - this would be different if everything wasn’t on the same server of course:
/usr/share/elasticsearch/bin/elasticsearch-certutil cert ca --pem --in /root/certs/instance.yml --out /root/certs/certs.zip
cd ~/certs/
unzip certs.zip
mkdir -p /etc/elasticsearch/certs/ /etc/kibana/certs/
cp ~/certs/elastic/elasticsearch/elastic.* /etc/elasticsearch/certs/ /etc/kibana/certs/
cp ~/certs/ca/ca.crt /etc/elasticsearch/certs/ /etc/kibana/certs/ /etc/journalbeat/ /etc/auditbeat/ /etc/filebeat/
I decided that the transport didn’t need to listen remotely and so could use HTTP over localhost, only the HTTP API and Kibana need to use TLS. The defaults enable TLSv1.1 and some ciphersuites that aren’t bad but I wanted to experiment with locking them down, so /etc/elasticsearch/elasticsearch.yml looks like this (transport crypto settings commented out):
node.name: elastic

path.data: /var/lib/elasticsearch
path.logs: /var/log/elasticsearch
network.host: 127.0.0.1
http.host: elastic.local
discovery.seed_hosts: ["elastic.local"]
cluster.initial_master_nodes: [ "elastic" ]

xpack.security.enabled: true
xpack.security.http.ssl.enabled: true
xpack.security.http.ssl.supported_protocols: [ TLSv1.2, TLSv1.3 ]
xpack.security.http.ssl.key: /etc/elasticsearch/certs/elastic.key
xpack.security.http.ssl.certificate: /etc/elasticsearch/certs/elastic.crt
xpack.security.http.ssl.certificate_authorities: /etc/elasticsearch/certs/ca.crt
xpack.security.http.ssl.cipher_suites: ["TLS_ECDHE_RSA_WITH_AES_256_GCM_SHA384"]
#xpack.security.transport.ssl.key: /etc/elasticsearch/certs/elastic.key
#xpack.security.transport.ssl.certificate: /etc/elasticsearch/certs/elastic.crt
#xpack.security.transport.ssl.certificate_authorities: /etc/elasticsearch/certs/ca.crt
#xpack.security.transport.ssl.enabled: true
#xpack.security.transport.ssl.verification_mode: certificate
#xpack.security.transport.ssl.cipher_suites: ["TLS_ECDHE_RSA_WITH_AES_256_GCM_SHA384"]
Now we can start ES and connect to it to generate some passwords (not everything can use API keys):
systemctl enable elasticsearch
systemctl start elasticsearch
/usr/share/elasticsearch/bin/elasticsearch-setup-passwords auto -u "https://elastic.local:9200"
Next we setup Kibana, my /etc/kibana/kibana.yml looks like this with one of those passwords inserted:
server.host: "elastic.local"
elasticsearch.hosts: ["https://elastic.local:9200"]
elasticsearch.username: "kibana_system"
elasticsearch.password: "*******"
server.ssl.enabled: true
server.ssl.certificate: /etc/kibana/certs/elastic.crt
server.ssl.key: /etc/kibana/certs/elastic.key
server.ssl.cipherSuites: ["ECDHE-RSA-AES256-GCM-SHA384"]
elasticsearch.ssl.certificate: /etc/kibana/certs/elastic.crt
elasticsearch.ssl.key: /etc/kibana/certs/elastic.key
elasticsearch.ssl.certificateAuthorities: [ "/etc/kibana/certs/ca.crt" ]
Now start Kibana:
systemctl enable kibana
systemctl start kibana
Then browse to https://elastic.local:5601/app/kibana and login as user “elastic” with its password.
Using the documentation here I generated some API keys with just enough permissions to act as a beats client. Here is the request to paste into the Kibana console:
POST /_security/api_key
{
  "name": "filebeat_localhost",
  "role_descriptors": {
    "filebeat_writer": {
      "cluster": ["monitor", "read_ilm", "manage_ingest_pipelines"],
      "index": [
        {
          "names": ["filebeat-*", "auditbeat-*", "journalbeat-*", "metricbeat-*"],
          "privileges": ["view_index_metadata", "create_doc"]
        }
      ]
    }
  }
}
It will return something like:
{
  "id" : "foo",
  "name" : "filebeat_localhost",
  "api_key" : "bar"
}
Which means your api_key variable for beats would be foo:bar as it takes the format id:api_key
To get some input to ES I configured /etc/filebeat/filebeat.yml (auditbeat/journalbeat/metricbeat are basically the same) like this, using that API key:
filebeat.inputs:
- type: log
  enabled: false
  paths:
    - /var/log/*.log

filebeat.config.modules:
  path: ${path.config}/modules.d/*.yml
  reload.enabled: false

setup.template.settings:
  index.number_of_shards: 1

output.elasticsearch:
  hosts: ["https://elastic.local:9200"]
  ssl.certificate_authorities: ["/etc/filebeat/ca.crt"]
  api_key: "foo:bar"

processors:
  - add_host_metadata: ~
  - add_cloud_metadata: ~
  - add_docker_metadata: ~
  - add_kubernetes_metadata: ~
Then start it:
systemctl enable filebeat
systemctl start filebeat
filebeat setup
filebeat modules enable system
Then we can see dashboards such as this in Kibana:
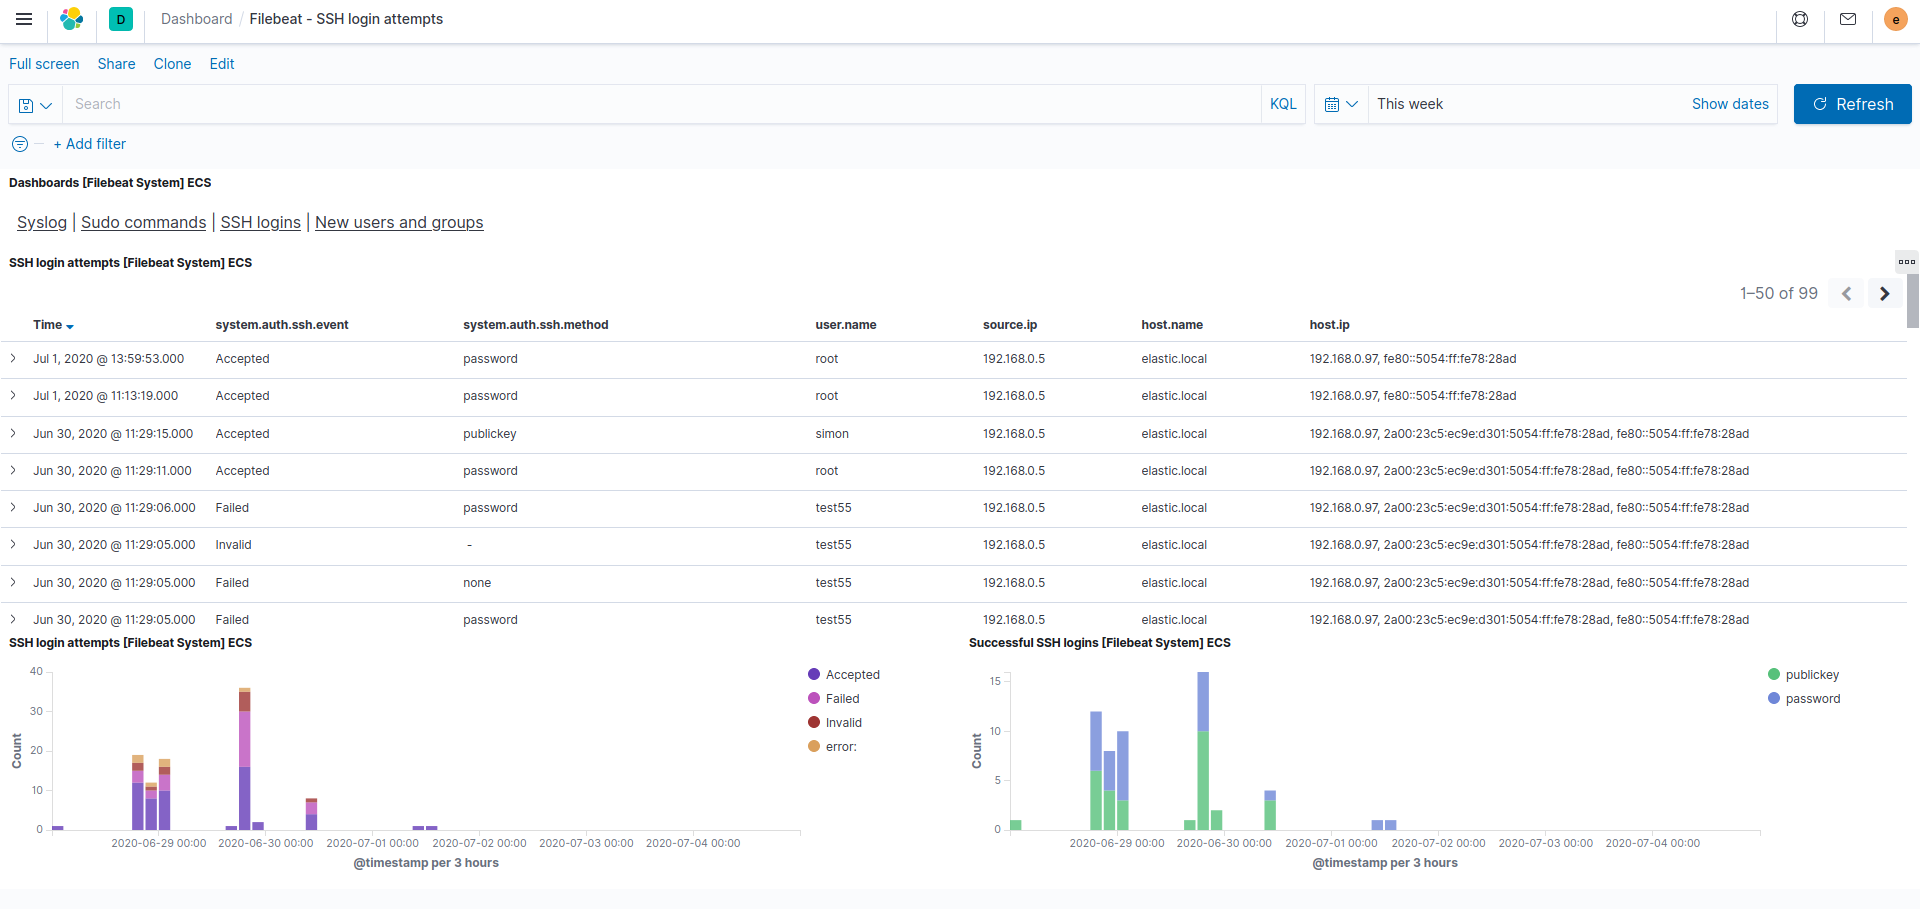
Next we configure rsyslog to listen on udp/514 by creating /etc/rsyslog.d/10-remote.conf containing:
$ModLoad imudp
$UDPServerRun 514
Then we configure the plugins we installed earlier to pass syslogs onto ES by creating /etc/rsyslog.d/12-elasticsearch.conf containing:
module(load="mmjsonparse")
module(load="omelasticsearch")

template(name="json-syslog" type="list" option.json="on") {
    constant(value="{")
    constant(value="\"@timestamp\":\"")     property(name="timereported" dateFormat="rfc3339")
    constant(value="\",\"host\":\"")        property(name="hostname")
    constant(value="\",\"severity-num\":")  property(name="syslogseverity")
    constant(value=",\"facility-num\":")    property(name="syslogfacility")
    constant(value=",\"severity\":\"")      property(name="syslogseverity-text")
    constant(value="\",\"facility\":\"")    property(name="syslogfacility-text")
    constant(value="\",\"syslogtag\":\"")   property(name="syslogtag")
    constant(value="\",\"message\":\"")     property(name="msg")
    constant(value="\"}")
}

template(name="rsyslog-index" type="string" string="rsyslog-%$YEAR%.%$MONTH%.%$DAY%")

action(type="mmjsonparse")

action(type="omelasticsearch"
  uid="elastic"
  pwd="*****"
  template="json-syslog"
  searchIndex="rsyslog-index"
  dynSearchIndex="on"
  server="https://elastic.local:9200"
  tls.cacert="/etc/elasticsearch/certs/ca.crt"
  errorfile="/var/log/omelasticsearch.log")
I’ve not yet figured out if its possible to use an API key with rsyslog, I suspect a lower-privileged user is the best option for now.
You can send some test syslog messages from a remote host by calling:
logger -s -pINFO -tTEST -n elastic -d 'Hello World!'
Or configure your remote client to send all authentication logs directly by creating /etc/rsyslog.d/10-remote.conf containing:
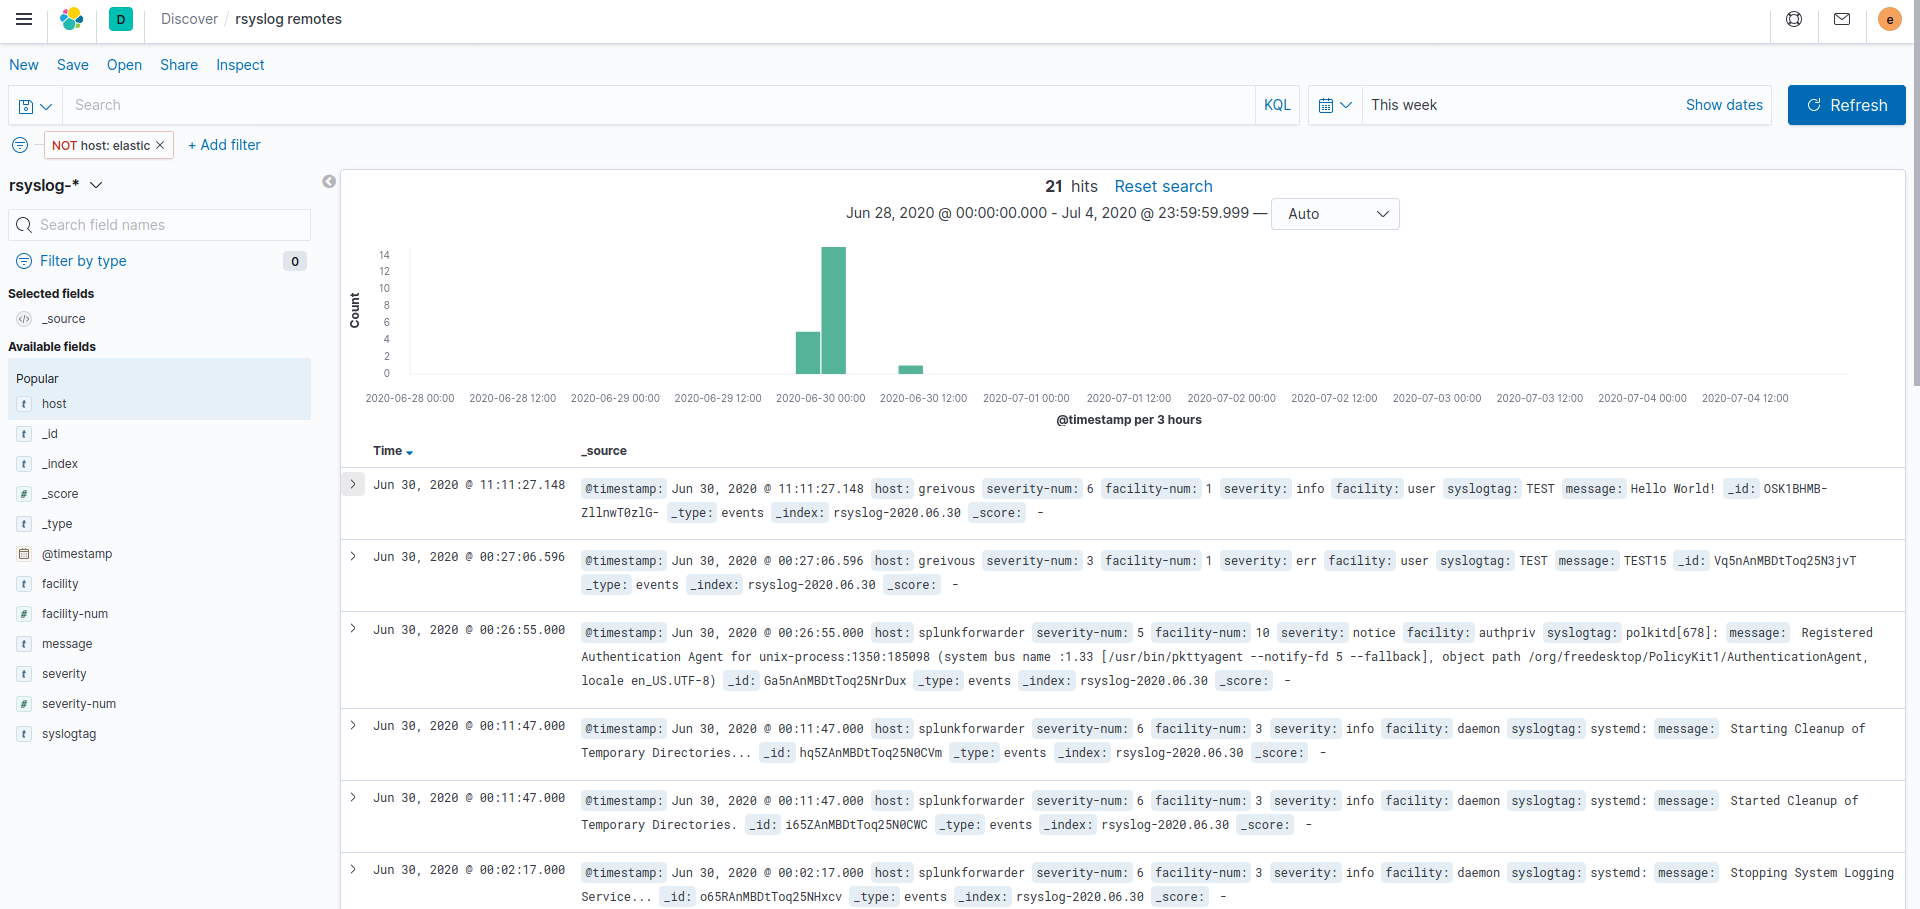
auth.* @192.168.0.97:514
I found that I had to create my own visualization and dashboard in Kibana:
Update: I tried the beta of elastic-agent and wow, that’s alpha-quality software! The RPM doesn’t even work and the tarball can’t handle custom CA certs, Fleet seems to corrupt itself if you try and then fail to enroll an agent…. Apparently even 8.0.0 beta is no better!
Update 2: absolutely do not enable Ingest Manager/Fleet, its totally corrupted my install to the point that the only logs I’m getting are from Auditbeat. Luckily I’d backed up the VM first!
Speaking of VM’s, qemu after v5.0.0 (basically master) just broke macos support, which means Debian package 5.0-6. Rolling back to 5.0-5 or even compiling git tag v5.0.0 fixes things again. I still have to reboot into 5.5 kernel to get VFIO working with macos even though Ubuntu/Win10 work fine with 5.7
I’ve also updated the theme on the blog a bit, made the screen 1280px wide rather than 800px as whilst that may be fine on a phone, its pretty wasteful on a 1080p monitor.